
티스토리 뷰
□ ELK Service 구성
- 마찬가지로 NBP Cloud 위에서 ELK 시스템을 구축해 나도한번 도전,, VM은 2개 사용할 것입니다.
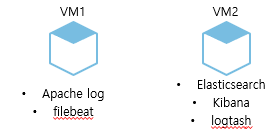
□ VM 구성도
▶ VM1에는 filebeat(로그를 라인별로 읽고 전달하며, 시스템이 중단되는 경우에도 마지막 중단점을 기억하여 재가동) 구성하여 Apache log를 VM2의 logstash에 보낼 것입니다.
▶ VM2에서는 logstash가 VM1에서 Apache log 를 수집해 Elasticsearch에 보내게 되고 이를 Kibana로 시각화 하게 됩니다.
□ 전체적인 흐름도

□ VM1
- apache access_log를 filebeat으로 수집하여 logstash로 보내기위해 Apache 및 filebeat가 설치되어 있는 VM
- apache는 설치되어 있다고 가정하고 filebeat install
filebeat 개념 및 특징
harvester: 하나의 파일의 내용을 읽는 애로써 하나의 파일을 읽어서 내용을 출력함. 파일을 열고 닫는것 까지 처리를 하고 있으며, 하비스터가 실행 되고 있으면 file descriptor 가 남아 있다는 의미임. 하비스터가 살아 있는데 파일이 지워져도 계속 잡고 있기 때문에 디스크 문제가 있을 수 있음 close_inactive 에 도달할 때 까지 파일을 열고 있음
prospector: 하비스터를 관리하고 읽어야 할 모든 소스를 찾는 역할을 하며, 자신만의 Go routine 을 가지고 실행함. log, stdin 타입만 지원하며, 프로스펙터당 2개 이상의 type 선언이 가능하다. 로그스태시처럼 어디까지 읽었는지 position 을 별도로 디스크에 저장함.
모듈 자세한 설명: https://www.elastic.co/guide/en/beats/filebeat/6.0/configuring-howto-filebeat.html
□ filebeat install
- documnet를 참고했습니다.
URL: https://www.elastic.co/guide/en/beats/filebeat/current/filebeat-installation.html
$ sudo curl -L -O https://artifacts.elastic.co/downloads/beats/filebeat/filebeat-7.6.1-x86_64.rpm

$ sudo rpm -vi filebeat-7.6.1-x86_64.rpm- systemctl 등록
$ sudo systemctl status filebeat.service
$ sudo systemctl start filebeat.service
$ sudo systemctl stop filebeat.service- logstash로 보내는 것으로 구성하기 때문에 logstash 부분만 주석 해제 [vi /etc/filebeat/filebeat.yml]
hosts의 아이피 2.2.2.2는 VM2의 NBP 기준 비공인아이피 10점대 대역을 입력해 주면 됩니다.
#----------------------------- Logstash output --------------------------------
output.logstash:
  # The Logstash hosts
  hosts: 2.2.2.2:5443


  # Optional SSL. By default is off.
  # List of root certificates for HTTPS server verifications
  #ssl.certificate_authorities: ["/etc/pki/root/ca.pem"]


  # Certificate for SSL client authentication
  #ssl.certificate: "/etc/pki/client/cert.pem"


  # Client Certificate Key
#ssl.key: "/etc/pki/client/cert.key"- path, fields의 index_name 정의
path에는 apache로그의 access_log를 수집할것이므로 적절한 경로를 입력하고 설정을 완료하고 나면 access_log 파일의 내용이 logstash를 거쳐 최종적으로 elasticsearch에 도달하게 됩니다.
filebeat.inputs:


# Each - is an input. Most options can be set at the input level, so
# you can use different inputs for various configurations.
# Below are the input specific configurations.


- type: log


  # Change to true to enable this input configuration.
  enabled: true


  # Paths that should be crawled and fetched. Glob based paths.
  paths:
    - /app/apache/logs/access_log
    #- c:\programdata\elasticsearch\logs\*


  # Exclude lines. A list of regular expressions to match. It drops the lines that are
  # matching any regular expression from the list.
  #exclude_lines: ['^DBG']


  # Include lines. A list of regular expressions to match. It exports the lines that are
  # matching any regular expression from the list.
  #include_lines: ['^ERR', '^WARN']


  # Exclude files. A list of regular expressions to match. Filebeat drops the files that
  # are matching any regular expression from the list. By default, no files are dropped.
  #exclude_files: ['.gz$']


  # Optional additional fields. These fields can be freely picked
  # to add additional information to the crawled log files for filtering
  fields:
  #  level: debug
    index_name: "hskim_file_index_name"
  #  review: 1


  ### Multiline options


  # Multiline can be used for log messages spanning multiple lines. This is common
  # for Java Stack Traces or C-Line Continuation


  # The regexp Pattern that has to be matched. The example pattern matches all lines starting with [
  #multiline.pattern: ^\[


  # Defines if the pattern set under pattern should be negated or not. Default is false.
  #multiline.negate: false


  # Match can be set to "after" or "before". It is used to define if lines should be append to a pattern
  # that was (not) matched before or after or as long as a pattern is not matched based on negate.
  # Note: After is the equivalent to previous and before is the equivalent to to next in Logstash
  #multiline.match: after
□ VM2
- VM2에서는 VM1에서 filebeat을 활용하여 access_log를 logstash로 전달받아 indexing 이후에 elasticsearch로 보내어 kibana로 시각화하여 볼 예정이다. 그러므로 logstash, elasticsearch, kibana가 설치되어 있어야 한다.
□ elasticsearch install
- java version 8 install yum으로 설치 가능한 jdk 목록 확인
$ yum list java*jdk-devel- open jdk 1.8.0 install
$ yum install java-1.9.0-openjdk-devel.x86_64- java version 확인
$ java -version

openjdk version "1.8.0_242"
OpenJDK Runtime Environment (build 1.8.0_242-b08)
OpenJDK 64-Bit Server VM (build 25.242-b08, mixed mode)- profile 설정 [vi /etc/profile]
export JAVA_HOME=/usr/lib/jvm/java-1.8.0-openjdk-1.8.0.242.b08-0.el7_7.x86_64
export PATH=$PATH:$JAVA_HOME/bin- profile 적용
$ source /etc/profile- elasticsearch install - signning key 받기
$ sudo rpm --import https://artifacts.elastic.co/GPG-KEY-elasticsearch- 저장소 등록 [vi /etc/yum.repo.d/elasticsearch.repo]
[elasticsearch-7.x]
name=Elasticsearch repository for 7.x packages
baseurl=https://artifacts.elastic.co/packages/7.x/yum
gpgcheck=1
gpgkey=https://artifacts.elastic.co/GPG-KEY-elasticsearch
enabled=1
autorefresh=1
type=rpm-md- yum install
$ sudo yum -y install elasticsearch- 설치 완료되면 경로 확인
Install path : /usr/share/elasticsearch
config file path : /etc/elasticsearch
Init script path : /etc/init.d/elasticsearch- 부팅시 자동 등록하기
[admin@vm2 init.d]$ sudo systemctl enable elasticsearch.service
Created symlink from /etc/systemd/system/multi-user.target.wants/elasticsearch.service to /usr/lib/systemd/system/elasticsearch.service.- 설치 확인
[admin@vm2 init.d]$ curl -X GET 127.0.0.1:9200
{
  "name" : "vm2",
  "cluster_name" : "elasticsearch",
  "cluster_uuid" : "Y7KSDuw-Ss2bgfosHqJGSQ",
  "version" : {
    "number" : "7.6.1",
    "build_flavor" : "default",
    "build_type" : "rpm",
    "build_hash" : "aa751e09be0a5072e8570670309b1f12348f023b",
    "build_date" : "2020-02-29T00:15:25.529771Z",
    "build_snapshot" : false,
    "lucene_version" : "8.4.0",
    "minimum_wire_compatibility_version" : "6.8.0",
    "minimum_index_compatibility_version" : "6.0.0-beta1"
  },
  "tagline" : "You Know, for Search"
}
□ kibana install
- rpm repo 등록 [vi /etc/yum.repos.d/kibana.repo]
[kibana-7.x]
name=Kibana repository for 7.x packages
baseurl=https://artifacts.elastic.co/packages/7.x/yum
gpgcheck=1
gpgkey=https://artifacts.elastic.co/GPG-KEY-elasticsearch
enabled=1
autorefresh=1
type=rpm-md- yum install
$ sudo yum install kibana- yml 파일 설정 [vi /etc/kibana]
server.host: "0.0.0.0"

elasticsearch.hosts: ["http://localhost:9200"]- systemctl 등록
$ sudo systemctl enable kibana.service
$ sudo systemctl start kibana.service- VM2에 부여한 공인아이피를 가지고 접속하면 Kibana 페이지를 볼 수 있습니다. ACG 5601 Port open
URL: http://공인아이피:5601

□ logstash install
▶ logstash는 플러그인 기반의 데이터 수집 및 처리 엔진으로서, 광범위한 플러그인이 구비되어 다양한 아키텍처에서 손쉽게 데이터를 수집, 처리, 전다할 수 있게 해줍니다.
▶ 프로세싱 스레드는 대기열에서 데이터를 마이크로 배치로 읽은 다음, 구성된 필터 플러그인을 통해 순서대로 처리합니다. 이렇게 해서 데이터가 구문 분석, 처리 및 강화됩니다.
▶ logstash는 특정 디렉토리의 모든 파일을 구성 파일로 사용하도록 구성할 수도 있습니다. 이것은 logstash.yml
- 위에서 elasticsearch 에서 gpg키를 받았으므로 아래 repo만 추가해주면 logtash install이 가능합니다 [vi /etc/yum.repos.d/logstash.repo]
[logstash-7.x]
name=Elastic repository for 7.x packages
baseurl=https://artifacts.elastic.co/packages/7.x/yum
gpgcheck=1
gpgkey=https://artifacts.elastic.co/GPG-KEY-elasticsearch
enabled=1
autorefresh=1
type=rpm-md- yum install 또는 tar 파일 압축풀기
$ sudo yum install logstash- logtash 실행
▶ 아래 명령어를 쳤을때 에러없이 나오고 [ps -ef | grep logtash] 했을때 프로세스가 올라와있다면 성공된 상태
$ cd /home/admin/logstash-7.6.1/bin

$ sudo ./logstash -f /home/admin/logstash-7.6.1/config/logstash-sample.conf- access_log를 보기위해 apache, filebeat이 설치되어있는 VM1에 접속하여 log 남기기
http://공인아이피/hskim_test_1234

- VM1 서버 access_log에서 확인해보면 정상적으로 log에 남음

□ kibana에서 확인해보기
- 인덱스 패턴 만들기
▶ Management에 들어가서 Kibana > Index Patterns 선택

- create index pattern을 클릭해 filebeat pattern 생성
□ 데이터 탐색해보기
- 좌측 메뉴의 Discover 클릭

- kibana에서 확인해보면 좀 전에 url 날렸던 hskim_test_1234 log가 정상적으로 찍힌것을 확인할 수 있다.

'DevOps' 카테고리의 다른 글
| [NBP Cloud] jupyterhub install (1) | 2020.05.27 |
|---|---|
| [NBP] haproxy 구성 (2) | 2020.05.14 |
| [NBP_Cloud] web / was 분리해서 구성해보기 - 4 (2) | 2020.01.28 |
| [NBP_Cloud] web / was 분리해서 구성해보기 - 3 (0) | 2020.01.28 |
| [NBP_Cloud] web / was 분리해서 구성해보기 - 2 (0) | 2020.01.28 |